Child Nutrition in Telangana

Designing Visual Aids For A Research Survey

Charts & Infographics

Client

Sneha Nimmagadda, University of Southern California (USC)

Timeline

Aug'24 - Sept'24

The project aims to provide information about the effects of childhood malnutrition on long-term health and economic outcomes to mothers of young children in rural India, as well as understand existing perceptions of their children’s nutrition levels.

Illustrated charts developed as part of an informative visual explainer
The brief invited RVL to create informative visual aids that would support the client in conducting a survey of mothers on the subject of child nutrition in Telangana. The target audience for this project were mothers in villages in two districts in Telangana that have children that are toddlers between the ages of 0-3 years.
The project consists of two parts—a data collection tool and an informative visual explainer. The data collection tool consists of A3 size charts that allow mothers to point at a lineup of children — arranged from shortest to tallest, and thinnest to heaviest — based on where they think their child would fit in the lineup. The format for the visual explainer was a Google Slide presentation replete with illustrations and simple charts explaining the concepts of good nutrition in young children, the long term impacts of undernourishment as a toddler, and the importance of protein in reducing undernutrition in toddlers. Both outcomes were translated in English and Telugu. The final deliverables were shown to the survey respondents in Telugu.
Process
A flow chart of our process in developing the visual aids
Context setting and collaboration
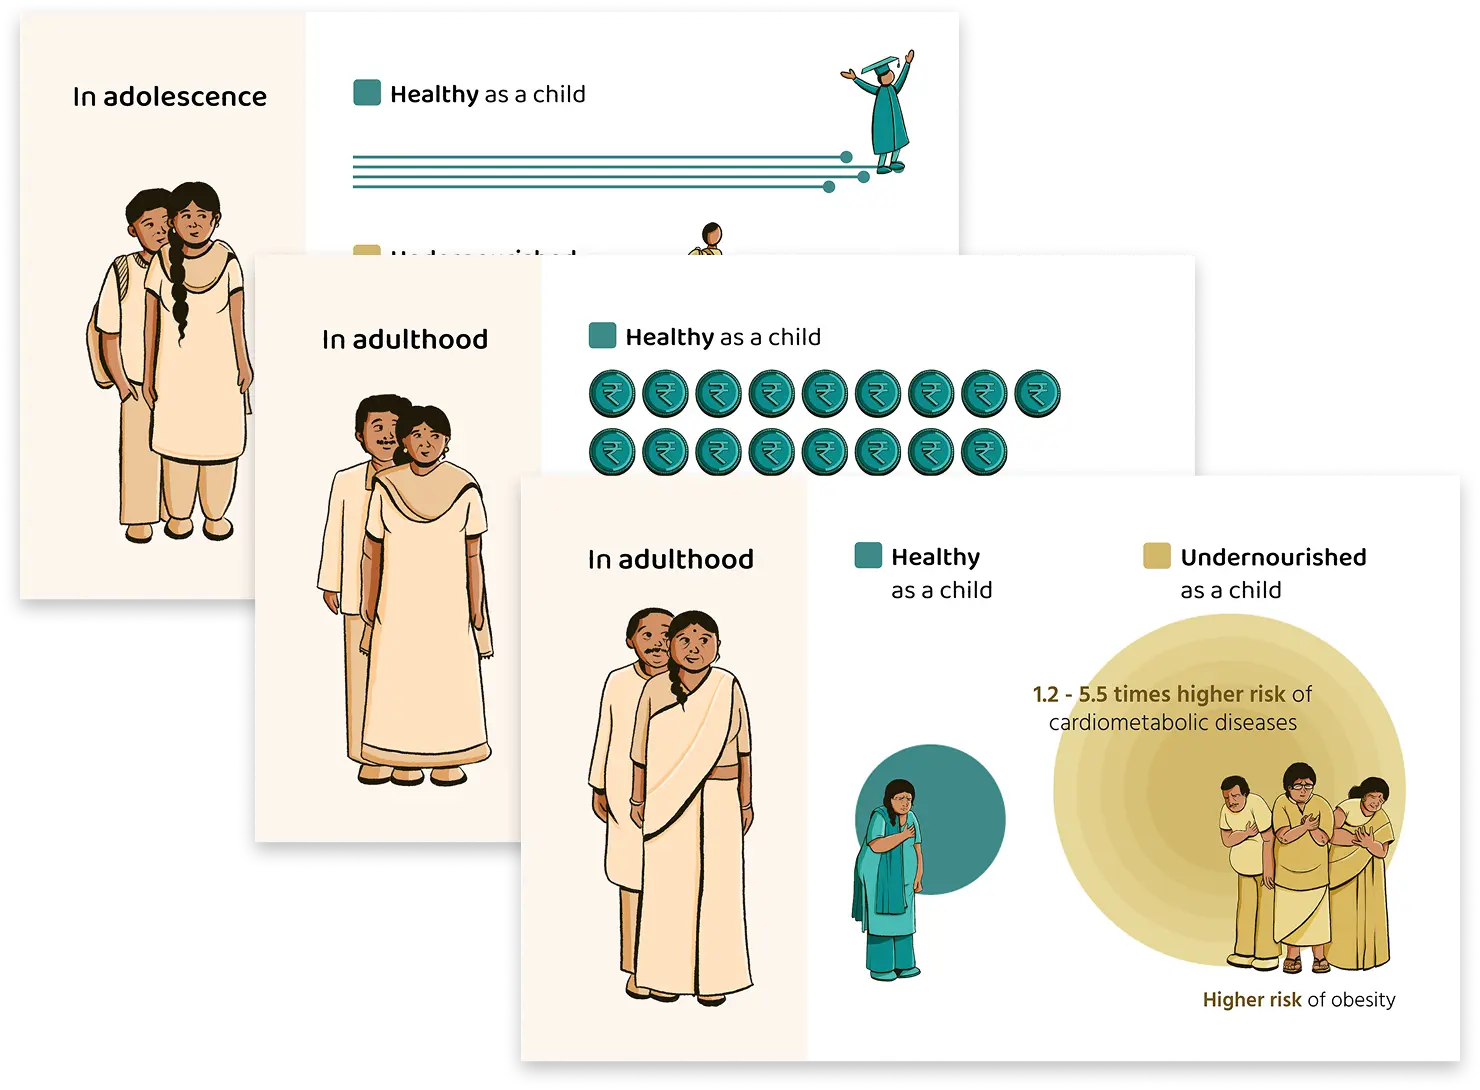
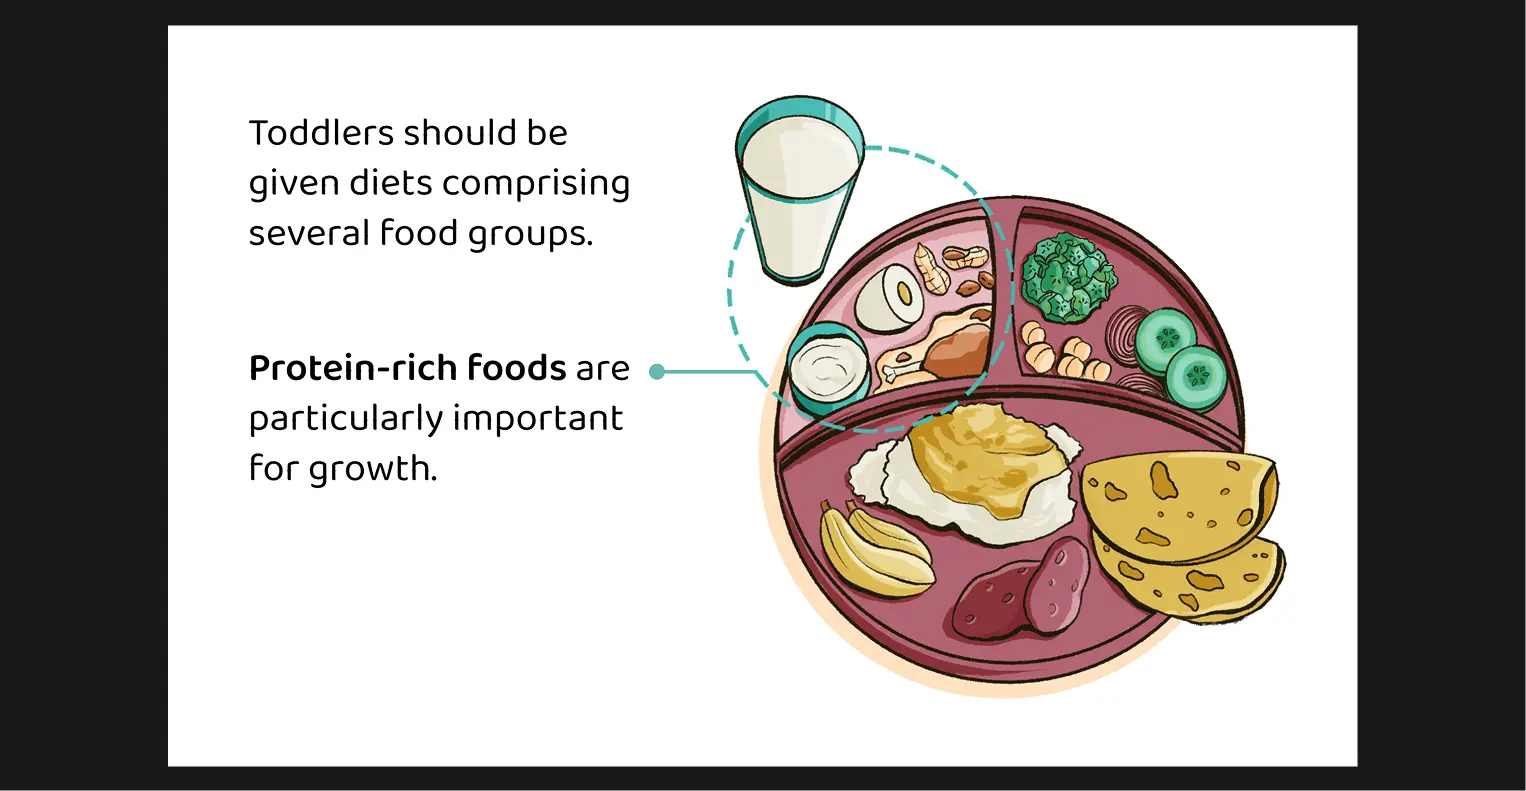
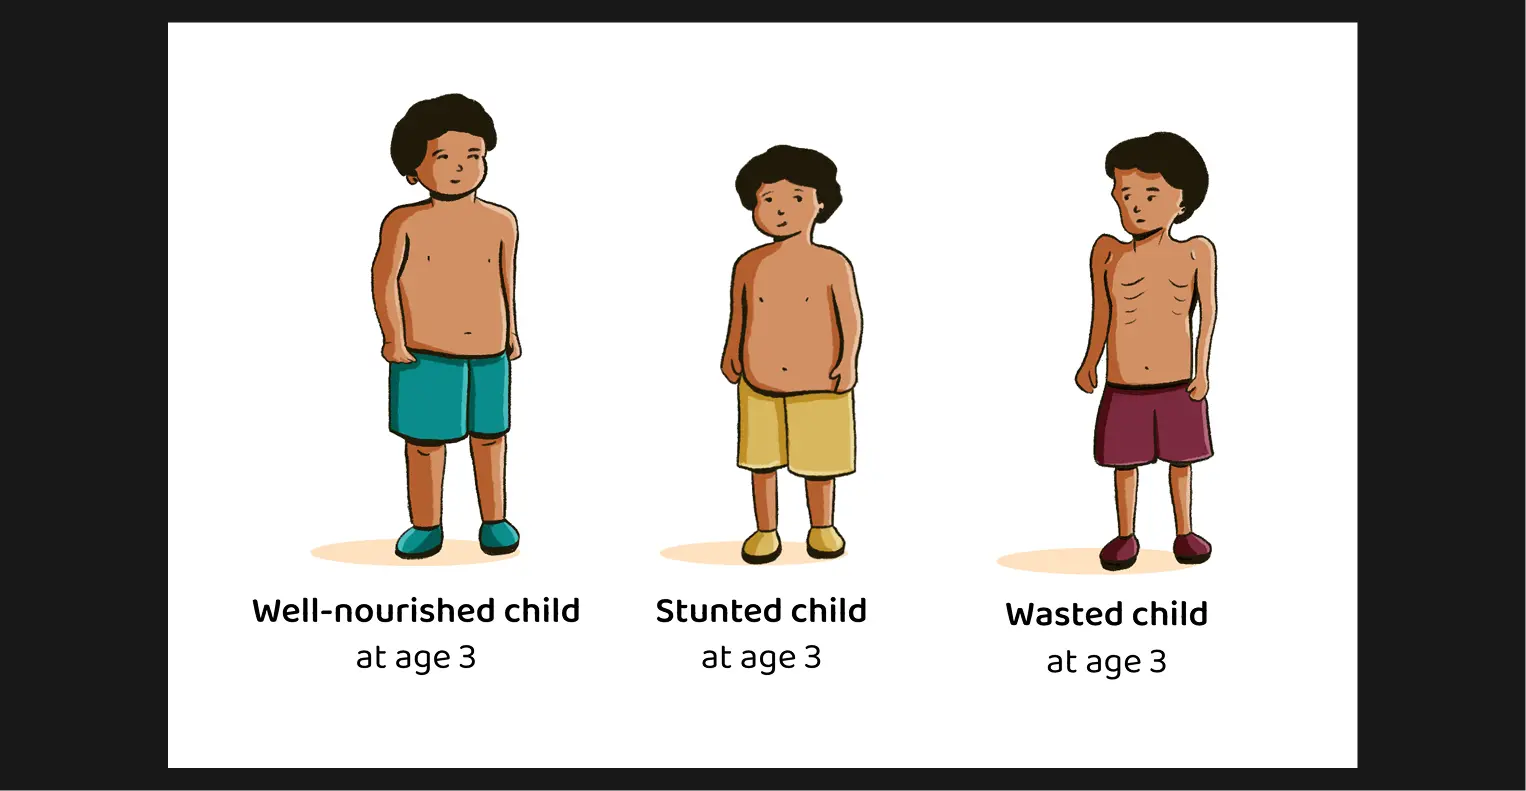
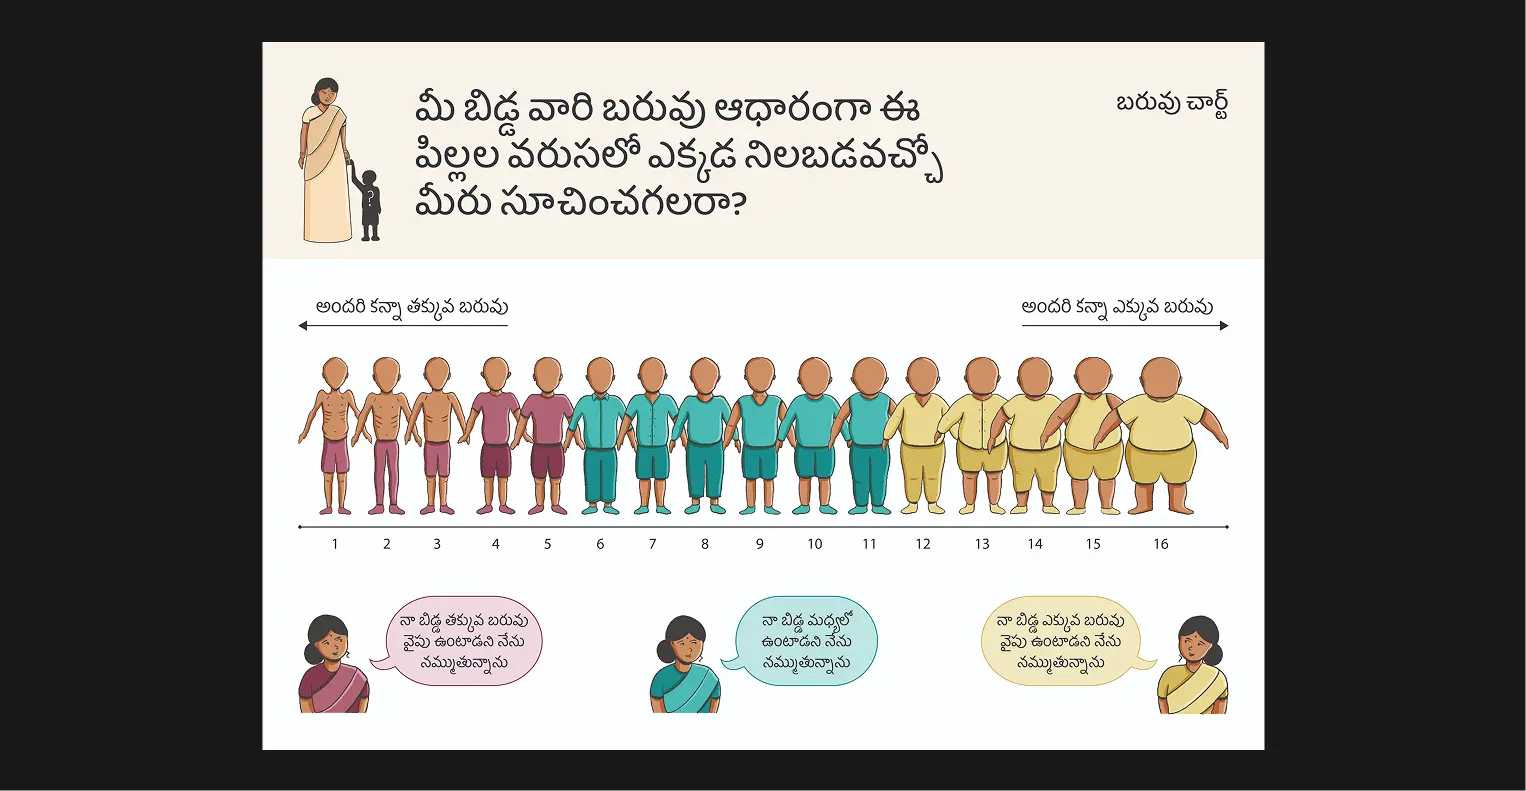
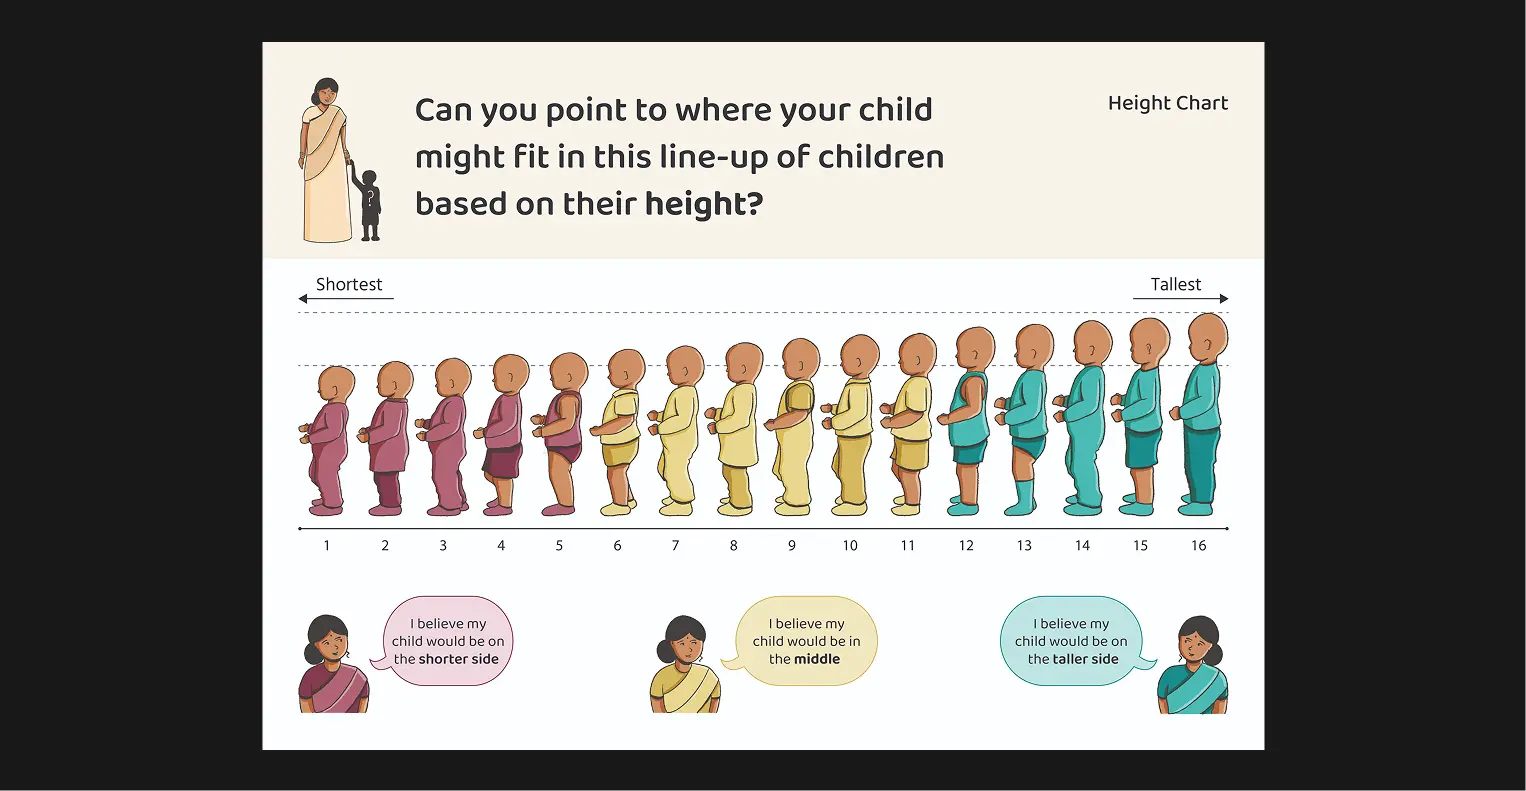
The process for this was a very collaborative one. The client, a PHD economics student at the University of Southern California (USC) received a grant to conduct a series of widespread surveys — consisting of a sample size of approximately 1500 mothers — in two districts in Telangana, her home state, in the last quarter of 2024. Prior to this, she had conducted a similar survey in 2023, wherein she had developed visual aids but weren’t very successful in gauging answers as it left mothers confused and unsure about the purpose of the aid. She wanted to address this problem, as well as bring in storytelling elements that allowed the concepts to be explained in simple, engaging ways. We developed the visuals alongside the client’s research input on the details in the illustrations. For example, the exact types of foods we could show in the illustrations that people from this state would eat regularly, government schemes to improve nutrition (for example, the Balamrutham supplement) and also helped significantly with the messaging, ensuring that the concepts were communicated clearly, making sure that the illustrations we developed were a close picture of what was happening on ground. There were also several discussions, exchanges and brainstorming sessions to ensure that both deliverables in the project would resonate and be correctly understood by the target audience.
Tools
Storytelling and Charts
Google Docs, Illustrator, Flourish, RawGraphs
Design and Ideation
Figma, Illustrator, Google Slides
Illustration
Photoshop, Procreate

I had a wonderful experience working with Revisual Labs on a project that aims to provide information about the effects of childhood malnutrition on long-term health and economic outcomes to mothers of young children in rural India. Gurman, Divya, and Rashi did an exceptional job of synthesizing information from a wide set of complex research studies into a clear and compelling storyboard, with vibrant illustrations and accessible charts. They provided valuable inputs during the conceptualization and design phases, and developed visual aids with great attention to detail. The entire process went smoothly and the final products exceeded my expectations. I look forward to collaborating with Revisual Labs again, and would also highly recommend them to anyone looking for help with data visualization and creative storytelling.

Sneha Nimmagadda's picture

Sneha Nimmagadda

PHD Candidate, University of Southern California

Project Team

Gurman Bhatia

Project Manager

Divya Ribeiro

Designer

Rashi Shah

Designer

PLACEHOLDER TO PREVENT ISSUES WITH CONTACT LINK