ISN Global Kidney Health Atlas
International Society of Nephrology February 2025
An interactive atlas designed to inform readers about the state of kidney care globally.
.webp)
We use cookies to understand how visitors interact with our website (for example, which pages are visited and which features are used). This helps us improve the site.
You can accept or reject analytics cookies below, and change your choice at any time.
DATA VISUALISATION AGENCY
A whole data universe, under one roof

.webp)


Our impact
From interactive dashboards to visual essays, from investigative reports to impact assessments, we connect the dots from data to narratives that inspire reflection and action
An interactive atlas designed to inform readers about the state of kidney care globally.
An interactive data driven story that maps the lives of refugees from Ukraine; their challenges, needs and support received.

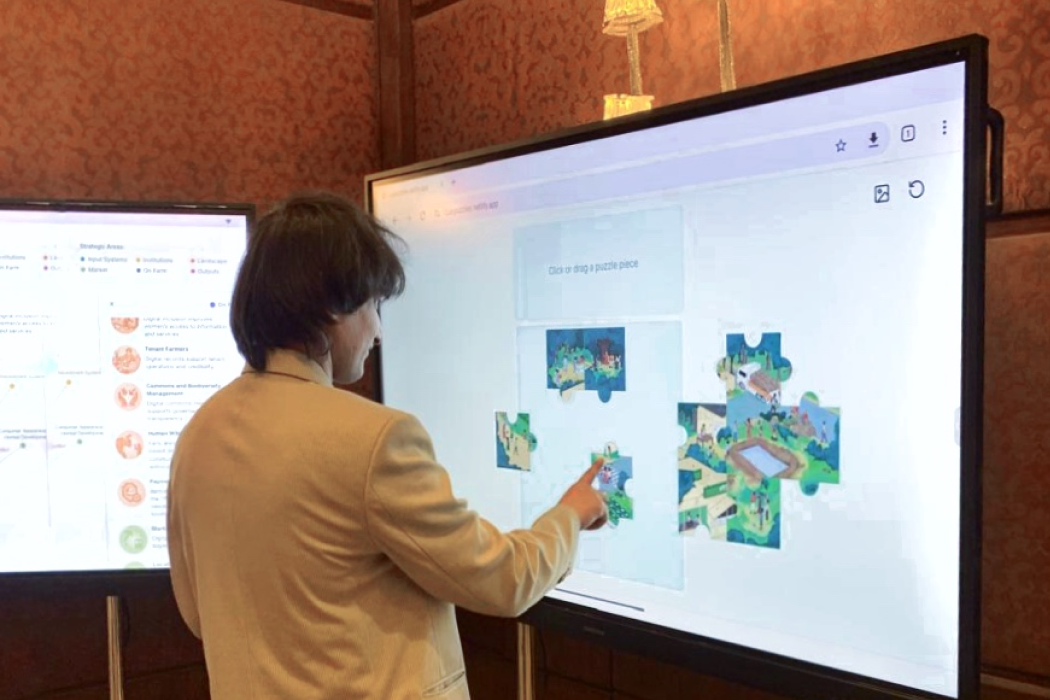
A set of interactive exhibits about the Landscape Approach of Agroecology.
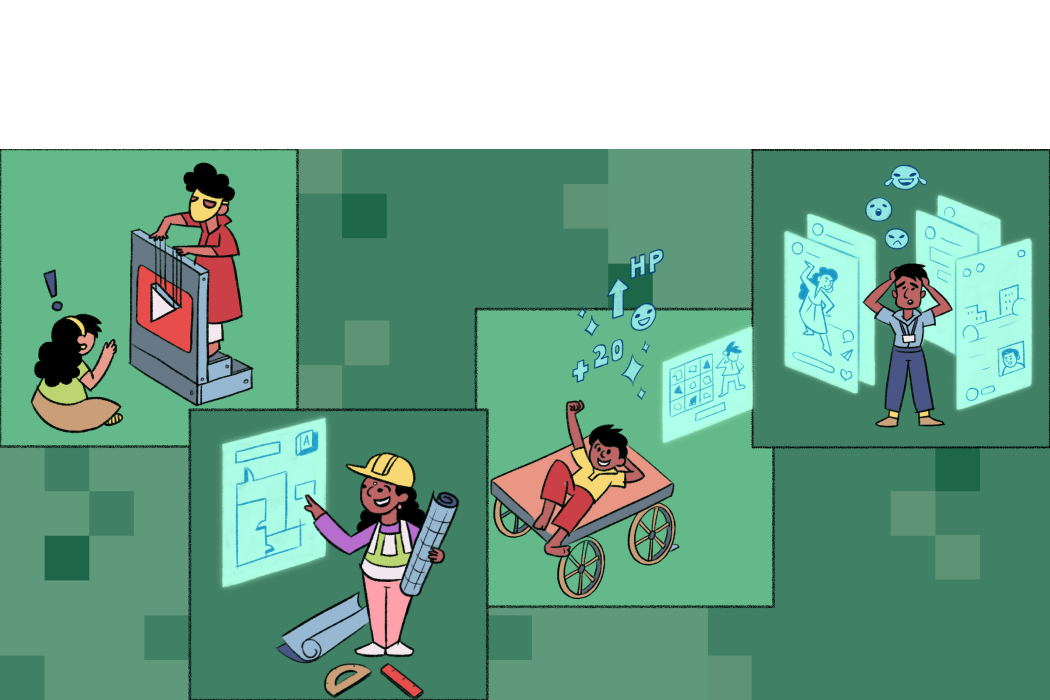
An interactive, illustrated collection of stories showcasing how young Indians use, understand and experience social media.
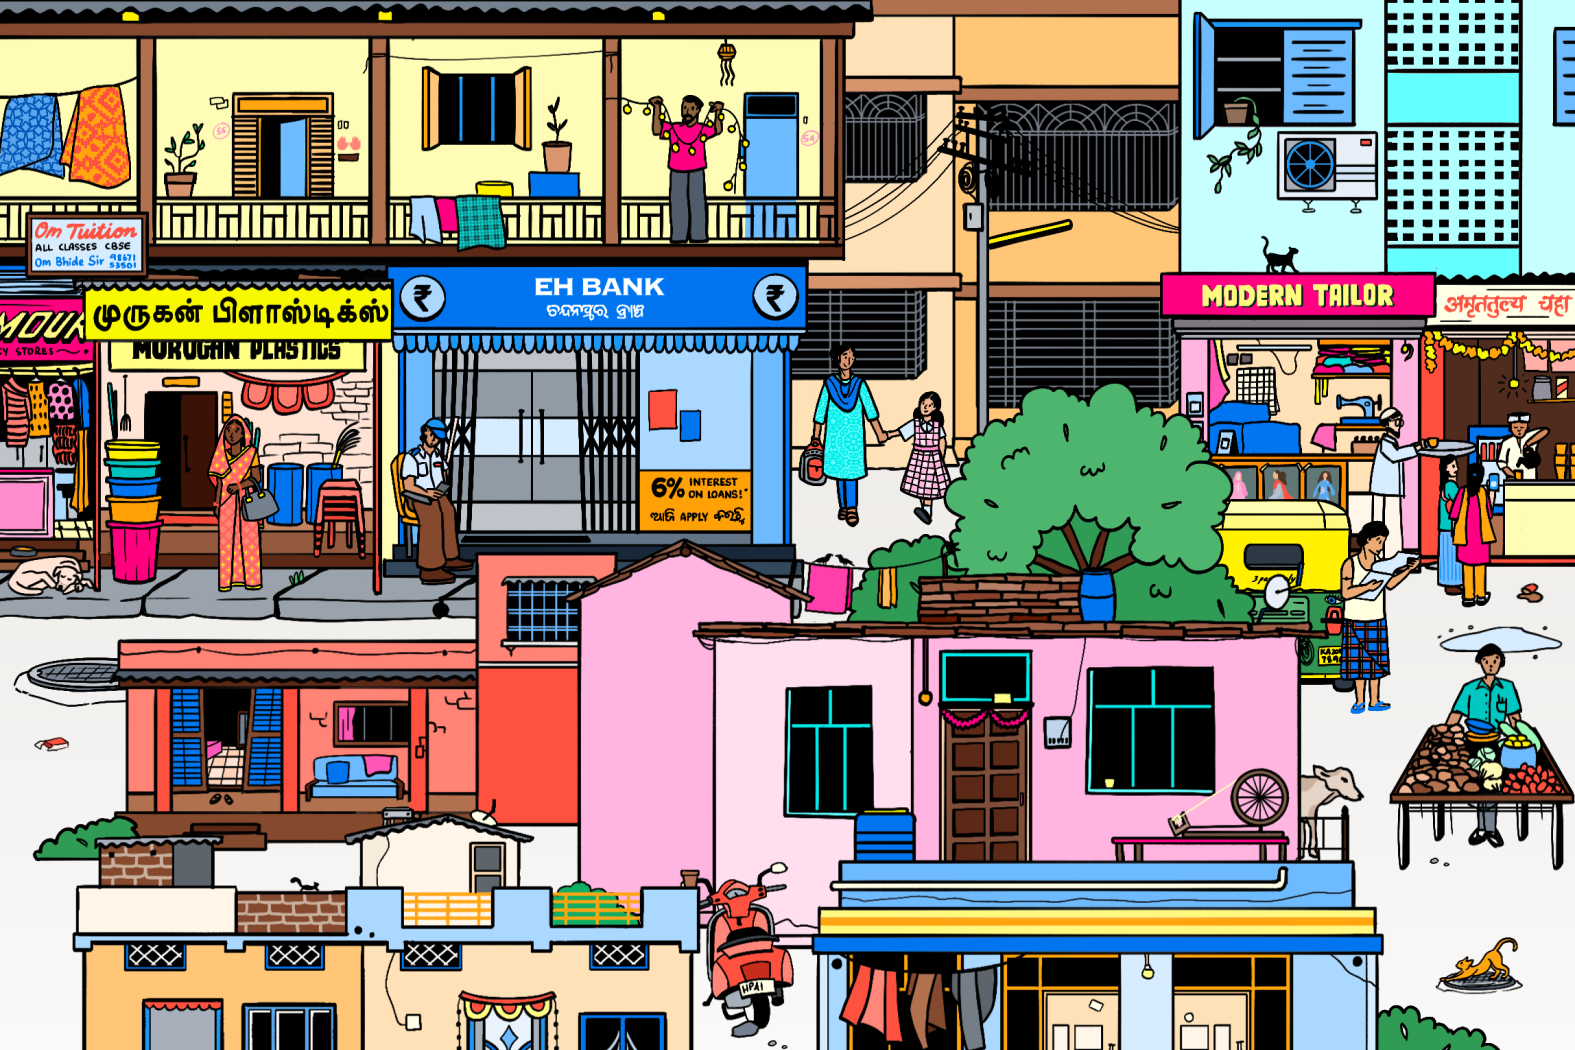
A data storytelling experience on how 5200 Entrepreneurial Households engage with India's financial systems to actively shape India's economic future.
Web design, motion graphics, and data storytelling for PhonePe’s Investor Relations website.
Revisual Labs is only two years old but is proving the true power of visualization through their substantial works already.
... Through their work and online presence they show their ability to deliver data projects both on the corporate dashboard end as well as experimental storytelling ideas.
OUR EXPERTISE
Revisual’s interdisciplinary team of professionals is equipped
with a range of analytical, technical, storytelling and visual skills.
TESTIMONIALS
We help you do extraordinary things with data.
Here’s what our clients and partners love about working with us:
“We found Gurman and the team very easy to work with on a project with tight deadlines. They were responsive and accommodating, instantly understanding the brief and explaining clearly what was feasible in the time available, and what would be required from our end. The end result looks great and performs smoothly - a great outcome.”
Reporter, Unearthed (Greenpeace)

Revisual Labs is transparent, easy to work with, execution focussed and very creative. We look forward to working with them again!
Global Platform for Sustainable Natural Rubber
.webp)
We needed our project ‘Mera First Vote’ to be fun while being serious, minimal while being vibrant, and easy to explore while presenting a complexity of narratives. Revisual Labs helped us achieve all this. From the get-go, the team understood our vision and made it their own. They reached into the deepest recesses of our minds to capture our ideas and turn them into the project that we imagined. This was a truly collaborative project and we would not only love to work with them in the future, but would also strongly recommend them to others.
BehanBox

The RVL team was responsive, communicative and always willing to incorporate feedback. They took the time to understand the project needs and created an exceptional product that meets all our expectations. Their attention to detail and ability to bring the vision to life were truly impressive. I would definitely recommend them.
International Initiative for Impact Evaluation (3ie)
Revisual Labs was well equipped with the skills and expertise to develop interactive data stories for our climate solutions project in India. The team’s biggest strength lies in its creative skillset to develop engaging visuals, illustrations and in building an understanding of the subject being talked about. There is a great amount of flexibility at RVL in terms of incorporating and using varied technology specifications requirements, messaging and communication, etc. We would recommend collaborating with Revisual Labs if you are looking to develop a range of communication collaterals, backed with data and cross-cutting linkages in your project.
WWF India

Thanks to the Revisual team for putting your heart and mind to it while designing the 2024 SIDE report. You made the charts and figures visually appealing, informationally intuitive, and greatly contributed in making the report accessible and friendly to non-technical audience. The enthusiasm and passion with which your team engaged with us is simply matchless. I will wholeheartedly recommend anyone thinking of designing a report to give a serious look at Revisual Labs!
Director, ICRIER

“Thanks to Gurman and the whole Revisual team, our data portal is now more than just a platform; it's an immersive experience that is leaving a lasting impression on our visitors. Their creative vision, technical expertise, and attention to detail sets them apart. I wholeheartedly recommend Gurman and Revisual to anyone seeking exceptional website design that not only transforms data into art, but also embraces challenges with creativity and resilience.”
International Office of Migration, United Nations

“Gurman delivered a bespoke microsite for our investigation into the Iraqi oil industry. She was a joy to work with and demonstrated an impressive ability to translate my requests for aspects of the site to be "softer" or "lighter" onto the page. Gurman is a talented journalist, as well as a top designer and web developer. She understands stories and how to make them work for an audience. I can't recommend her highly enough.”
Reporter, Unearthed (Greenpeace)

Working with Gurman, Swathi, and the Revisual Labs team on our Investor Relations website was genuinely enjoyable. Their deep understanding of investor communications and financial storytelling was clear from the first conversation.
They excelled at turning complex financial narratives into compelling data visualizations that were both clean and highly effective. Crucially, their work was development-ready; the UI was so well-considered that the handoff was seamless, with no last-minute feasibility issues. The team also expertly navigated our existing design system, ensuring the final output felt like a natural extension of PhonePe’s identity. Throughout the process, they were incredibly responsive and clear, delivering quick iterations without sacrificing creative quality. If you're looking for a team that brings data visualisation expertise, strong visual thinking, and practical execution, Revisual Labs is a solid choice.
PhonePe

This is an incredible group of people who care about environmental sustainability and are eager to spend time to learn about the problem before offering insights. The final products were deeply appreciated by our partners. Good partner to huddle with for communication challenges.
Consortium for Agroecological Transformations

Collaborating with Revisual Labs was a great experience. Their responsiveness, clear communication, and innovative ideas made the process smooth, resulting in a dynamic and impactful map. A productive collaboration!
International Society of Nephrology

OUR WISHLIST
Our team made a list of dream projects we’d love to work on. Explore the list and and if one of these ideas matches an idea you’ve been hoping to bring to life, we’d love to hear from you.
WORK WITH US
Take the first step towards revolutionizing your data narratives.
Or write to us at hello@revisual.co
FAQs
Browse through these questions to understand how we work with your data.